Documentation Index
Fetch the complete documentation index at: https://claworc.com/docs/llms.txt
Use this file to discover all available pages before exploring further.
Usage dashboard
The Usage page (admin only) is accessible from the sidebar. It shows aggregated statistics for all requests proxied through the LLM gateway.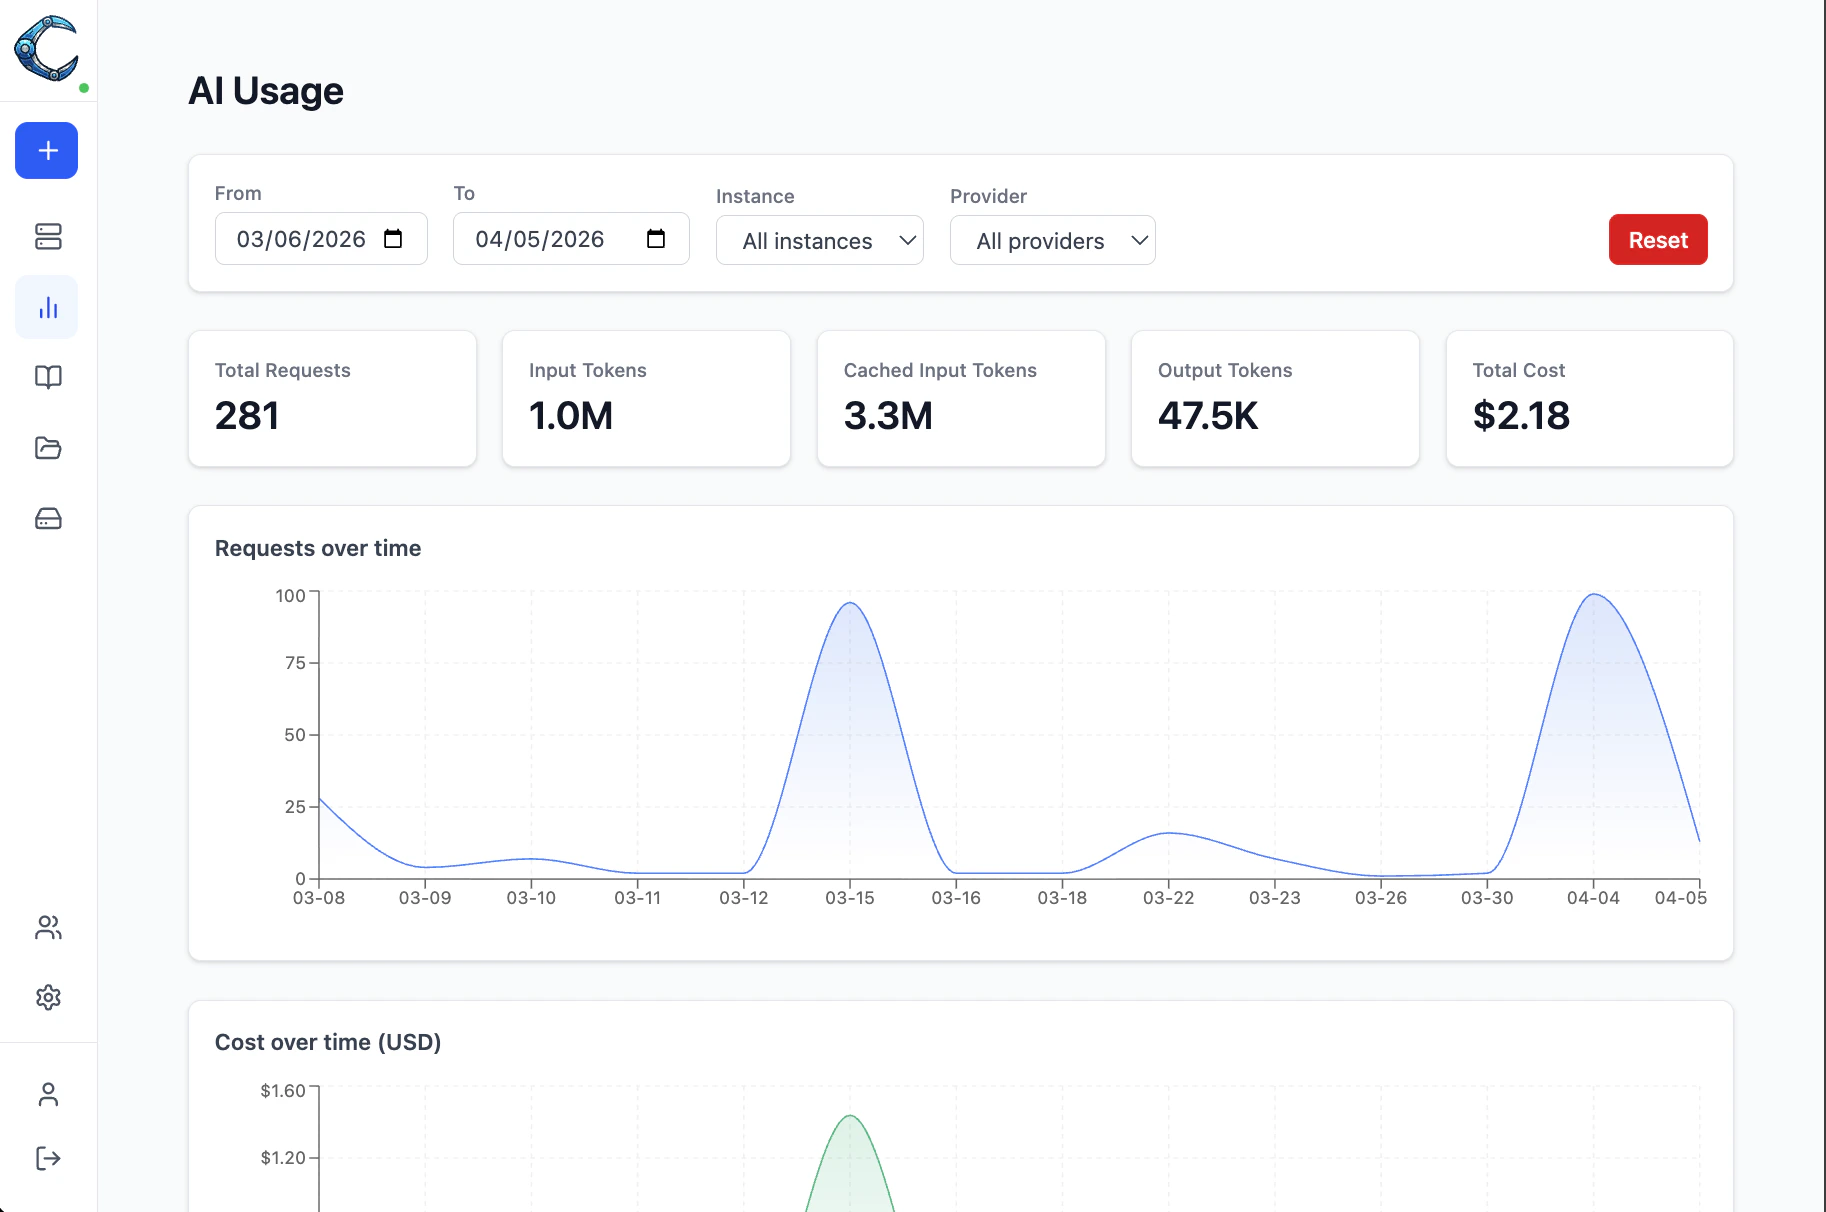
- Summary cards — total requests, input tokens, cached input tokens, output tokens, and estimated cost for the selected period
- Requests over time — area chart of daily request volume
- Cost over time — area chart of daily spend in USD
- Cost by instance — horizontal bar chart showing which instances are spending the most
- Cost by provider — horizontal bar chart breaking down spend by provider
- Tokens by model — stacked bar chart of the top 10 models by token volume